End-to-End Data Pipeline with Databricks [Medallion Architecture]-2026 github link
- Built a scalable data pipeline using Databricks, implementing the medallion architecture for structured data processing.
- Ingested raw e-commerce data and processed through Bronze → Silver → Gold layers
- Performed transformations using PySpark and SQL within Databricks
- Designed cleaned and aggregated datasets for analytics use cases
- Explored business insights using Databricks AI (Genie) for natural language queries
- Built a basic AI-powered BI dashboard using prompt-driven analytics
- Gained exposure to workflow orchestration within the Databricks environment
Tools: Databricks, PySpark, SQL.
Focus: Data pipelines, distributed processing, modern data architecture
Modern Data Transformation Pipeline with dbt & Redshift-2026 github link
- Developed a modular ELT pipeline using dbt Cloud on AWS Redshift, transforming raw data into analytics-ready models.
- Implemented layered data architecture: raw → staging → marts
- Built reusable dbt models to transform and structure warehouse data
- Applied version control using GitHub for collaborative and trackable development
- Implemented data quality tests (e.g., null checks, uniqueness) to ensure data reliability
- Designed analytics-ready tables for downstream reporting and BI tools
Tools: dbt Cloud, AWS Redshift, SQL, GitHub
Focus: Data modeling, transformation workflows, data quality
Global Happiness Analysis Dashboard-2025 tableau public link
- Built an interactive Tableau dashboard analyzing global happiness trends across countries using the 2024 dataset.
- Visualized global average happiness, and identified top and bottom-ranked countries
- Designed an interactive world map to compare country-level happiness scores and rankings
- Analyzed key contributing factors (GDP, social support, life expectancy, etc.) using comparative bar charts
- Explored correlation between GDP and happiness through scatter plot analysis
- Identified outliers where happiness deviates from economic expectations (high happiness–low GDP and vice versa)
- Summarized insights in an executive dashboard for quick decision-making
Tools: Tableau
Focus: Data visualization, exploratory analysis, insight generation
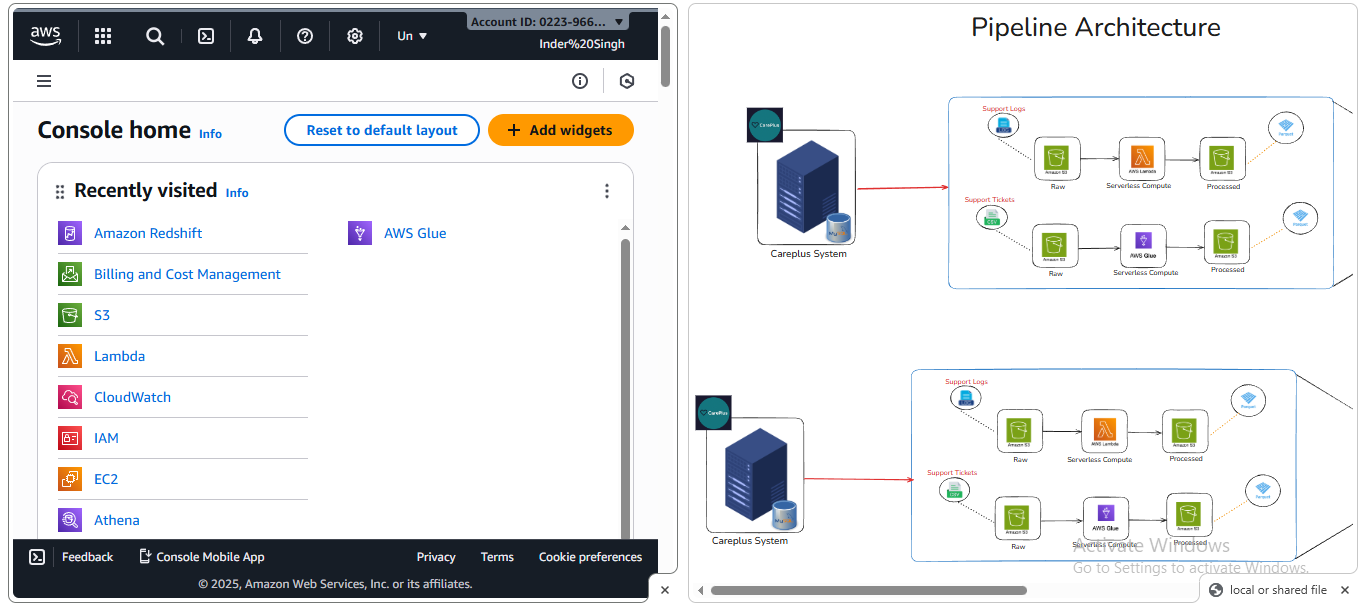
Automated ETL data Pipeline [Python | SQL | AWS | Power BI | 2025]
- Designed and implemented an end-to-end automated ETL pipeline to move data from an OLTP source into an OLAP environment for analytics.
- Built a cloud-based architecture using AWS S3 (data lake), Glue (transformation), Lambda (automation), and Redshift (data warehouse).
- Automated data ingestion, cleaning, and transformation triggered by new file uploads.
- Enabled ad-hoc querying via Athena and downstream Power BI dashboards for reporting.
- Demonstrated scalable, production-style data workflows and automation principles.
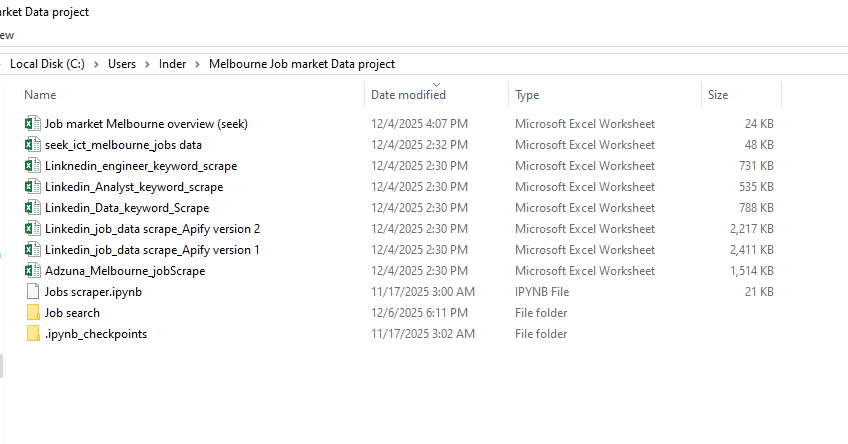
Melbourne Job Market Analysis [Python | Excel | 2025]
- Analysed Melbourne job market trends to identify role demand, hiring companies, and skill requirements.
- Collected job posting data from multiple sources using Python, APIs, and web scraping tools.
- Cleaned and consolidated datasets to identify high-demand roles and employer activity.
- Produced summary insights to support career and workforce planning decisions.
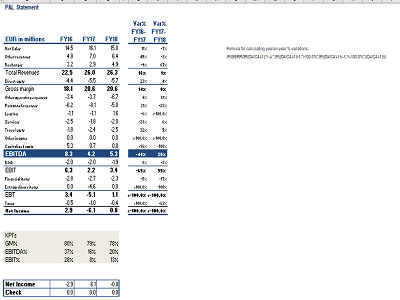
Profit & Loss Analysis [Excel | Financial Analysis | 2023] Github Link
- Built a structured P&L statement from raw financial extracts spanning multiple financial years.
- Cleaned and categorised financial data to enable clearer expense and revenue analysis.
- Created mappings to group common P&L items for easier interpretation by stakeholders.
- Demonstrated how financial data can support cost control and budgeting discussions.
Real Estate Statistical Analysis [Excel | Statistics | 2023] Github Link
- Performed exploratory and statistical analysis on real estate datasets to identify pricing and demand patterns.
- Applied frequency distributions, Pareto analysis, and correlation techniques.
- Created visual summaries to support marketing and targeting strategy discussions.
- Demonstrated practical use of statistics for business decision-making.
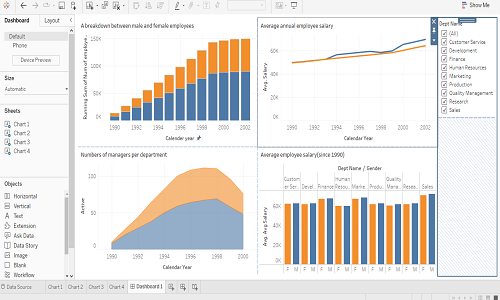
Workforce Gender Gap Analysis [ SQL | Excel | Tableau | 2023] Github Link
- Analysed workforce data (~1.3M records) to assess gender representation across departments.
- Used SQL to extract and filter relevant employee data for analysis.
- Built a Tableau dashboard to visualise disparities and trends.
- Demonstrated how data can support HR and diversity reporting initiatives.
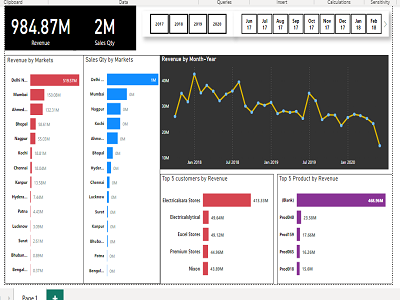
Sales Performance Dashboard [SQL | Power BI | Tableau | Excel | 2023] Github Link
- Analysed sales transaction data (~150k records) to identify trends and performance drivers.
- Performed data extraction and cleaning using SQL and Excel.
- Built interactive dashboards in Power BI and Tableau to track KPIs.
- Enabled stakeholders to explore trends and support sales planning decisions.